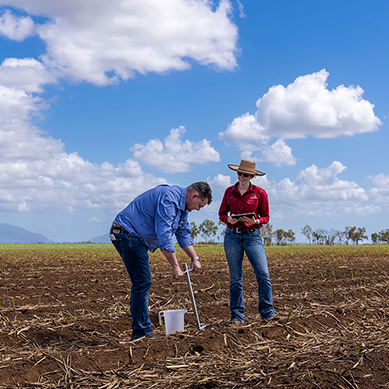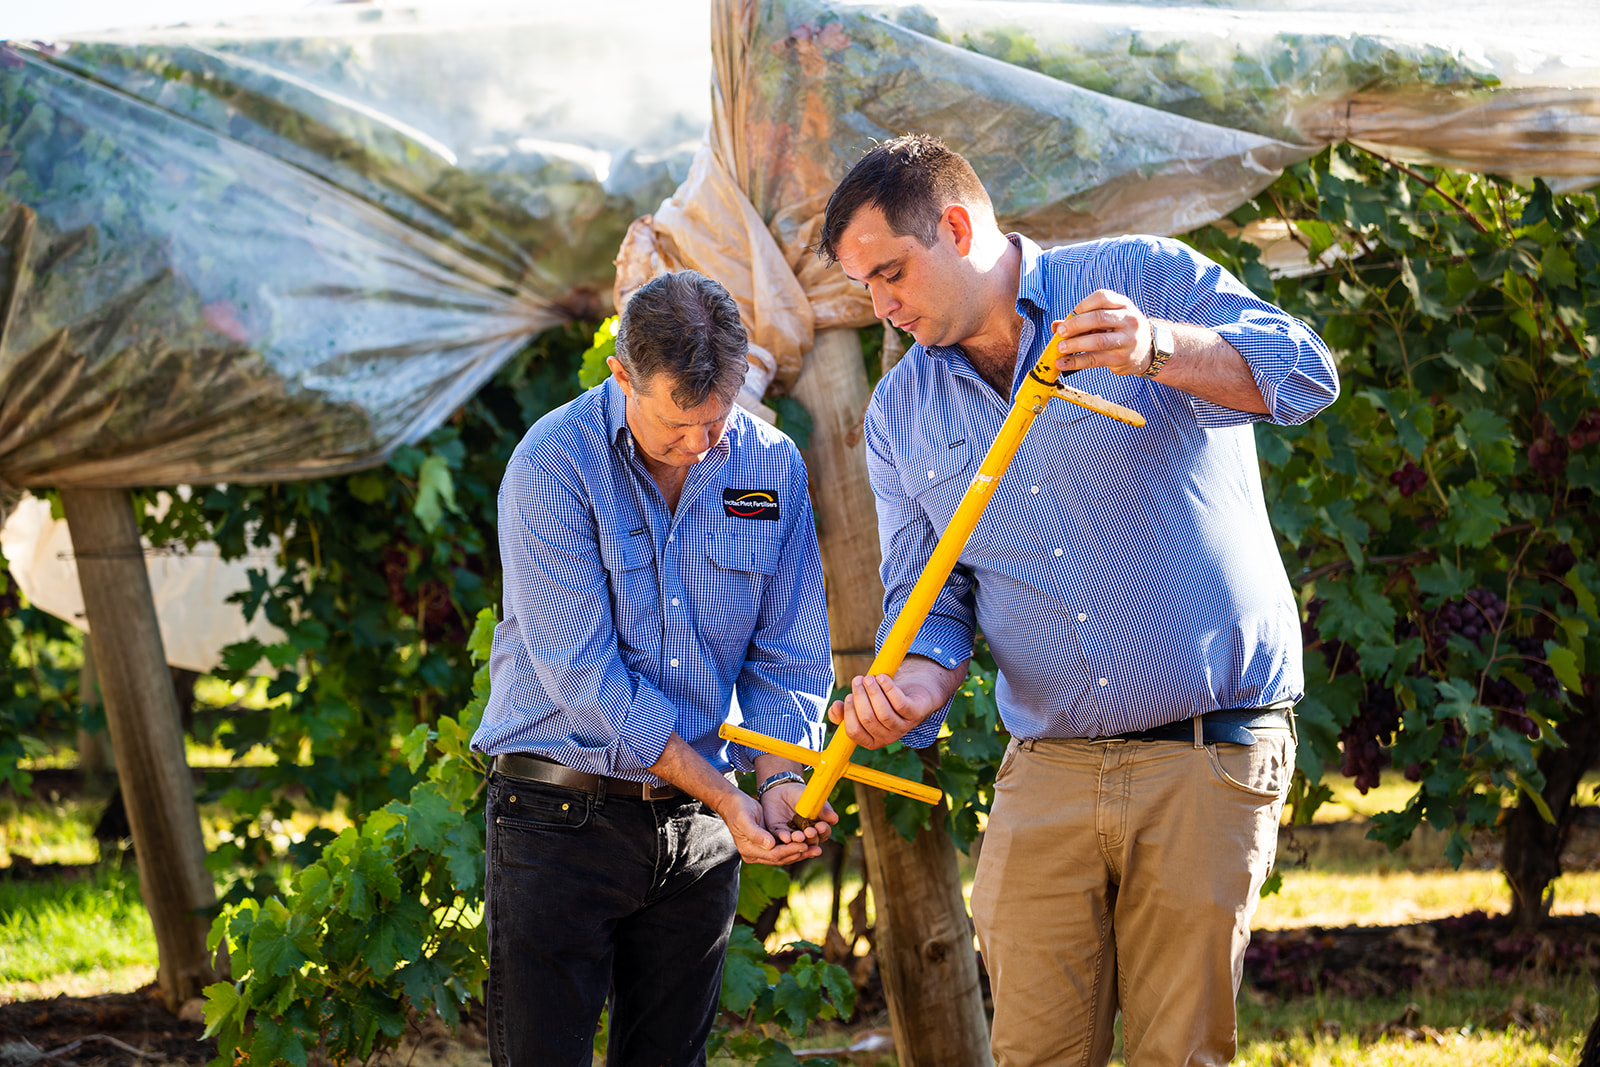
Soil sampling in established tree crops and grapevines
David McRae – IPF Technical Agronomist
Profitable tree crops and grapevines require the right combination of adequate moisture and sufficient nutrient levels to allow growth and fruit/nut development. Soil sampling and plant tissue testing in bearing perennial tree crops and grapevines can be effectively used to understand nutrient availability and manage/modify fertiliser programs.
Why soil sample?
The answer to this question should guide the way a sample is taken. Soil sampling and analysis is a valuable Nutrient Advantage tool, providing insight into the nutrient and general fertility status of surface (and if analysed, sub-surface) soil layers.
Soil analysis is normally undertaken for one of three reasons. These are:
- predictive – to check on the soil’s fertility or nutrient status, to better determine or predict nutrient requirements.
- monitoring – to assess the suitability of current management practices over time, adjusting existing fertiliser programs if necessary to ensure optimum yields are achieved.
- diagnostic – to determine the reason for poor growth (troubleshooting), or to check on accumulation of mineral elements toxic to plants.
The outcome is to arrive at a fertiliser recommendation tailored to the individual requirements of each production system.
Steps to successful sampling
1. Sampling time
Sampling in tree crops and grapevines is generally conducted from late autumn through to late winter.
2. Sampling depth
For bearing and non-bearing fields, the correct sampling depth is 0-15cm. When sampling a new area to be planted, the correct sampling depth is 0-30cm. Soil samples can be taken to deeper depths, but the first segment must adhere to these sampling depths.
3. Sampling position
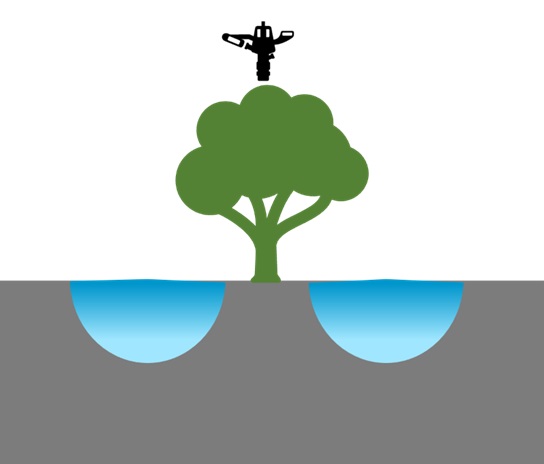
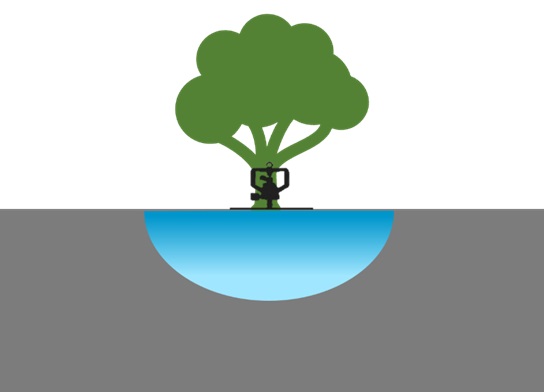
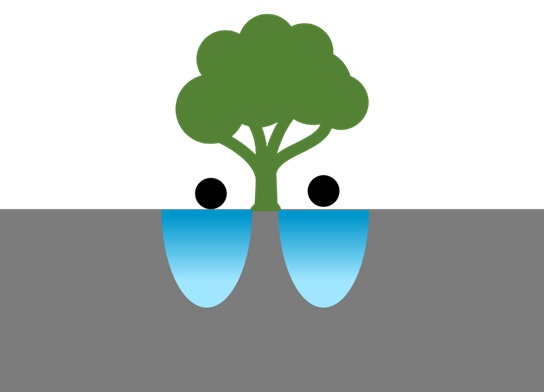
Plant root activity in permanently planted crops will guide the correct sampling position. Root growth generally occurs in moist soil, which is influenced by the irrigation method. Figures 1, 2 & 3 highlight three different application methods. The blue area, which represents root activity, is slightly different for each of the situations.
4. Application method
Understand the influence of fertiliser application method on the location of applied nutrients in the irrigated area. Depending how fertiliser is applied, nutrients may be evenly spread across the irrigated area for spread fertilisers or concentrated either under the dripper or at the each of the irrigated area with fertigated drip applications.
Soil properties such as PBI-Col and Cation Exchange Capacity (CEC) and nutrient charge, effect the movement of fertigated nutrients.
What is happening in the irrigated root zone?
Soil samples were taken to investigate the effect of fertiliser application method under drip irrigated orchards in the Riverina that had fertiliser applied either by fertigation or a combination of fertigation and broadcast over several years.
Soil cores were taken from under the drip tape (sample location 2) and just inside the edge of the irrigated area (sample location 1). Selected results from analysis conducted by the Nutrient Advantage Lab from a 0-15cm sampling depth are displayed in Table 1. Both soils are clays with low PBI and CEC.
A review of the soil sample results showed:
- Electrical conductivity (EC) and chloride are both uniform between both sampling positions.
- Nitrate-nitrogen (N) is lower in all samples.
- This would be expected in well-managed orchards as samples were taken towards the end of the growth cycle.
- Elevated levels of nitrate-N would indicate N has recently been applied or above optimum rates have been applied.
- Phosphorus (P) uniformity varies between both A and B sites.
- Site A had P applied as broadcast granular P and site B had P fertigated. At site B, there is a large difference between sample location 1 and 2.
- Even though P has been applied by fertigation, the low PBI has allowed P movement with soil water movement.
- Soil texture and PBI have a large influence on the movement of P in soils.
- Potassium (K) levels are higher at both sites for sample location 1.
- K has been applied via fertigation at both sites for the last few seasons.
- Site A had broadcast K three seasons ago, which is evident by the higher K levels at sample location 2 than Site B.
- The movement of K from the dripper line to sample location 1 in these lower CEC soils is not usual.
Table 1: Results of soil sample taken from established orchards with different fertiliser application methods
| Fertiliser application method | Fertiliser application method | Fertiliser application method | Fertiliser application method | |
| Site A Broadcast and Fertigated | Site A Broadcast and Fertigated | Site B Fertigated | Site B Fertigated | |
| Edge of Irrigated area (1) | Under Dripper (2) | Edge of Irrigated area (1) | Under Dripper (2) | |
| Soil Texture | Clay | Clay | Clay | Clay |
| Elec. Cond. (Sat. Ext.) (dS/m) | 0.5 | 0.4 | 1.1 | 1.1 |
| Chloride (mg/kg) | 19 | 14 | 160 | 160 |
| Nitrate-nitrogen (mg/kg) | 6.9 | 6.4 | 5.7 | 2.7 |
| Phosphorus (Colwell) (mg/kg) | 120 | 130 | 57 | 27 |
| PBI-Col | 74 | 70 | 33 | 46 |
| CEC (cmol(+)/kg) | 11.4 | 9.8 | 8.6 | 7.8 |
| Available Potassium (mg/kg) | 290 | 190 | 290 | 130 |
Selecting where to take samples
A few factors should be considered when determining where soil samples should be collected. Maximum root activity or feeder roots usually occurs within areas of adequate soil moisture, which has been either supplied by irrigation or rainfall. This zone generally contains a large percentage of active roots, which are responsible for water and nutrient uptake. It is important to identifying these areas in your tree crops and grapevines as collecting soil cores from these areas will provide the best information on the level of nutrient available for plant uptake.
Irrigation method by fertiliser application combinations
- Overhead sprinklers or rainfall.
- Generally, fertiliser is broadcast or surface banded 30cm either side of the tree drip zone.
- Low level or micro-sprinklers.
- Fertiliser can either be broadcast into the irrigated area or applied by fertigation.
- Take soil cores randomly from the irrigated zone.
- Fertiliser can either be broadcast into the irrigated area or applied by fertigation.
- Drip tape / dripper line
- Fertiliser either applied by banding granular fertiliser over drip tape or fertigation
- Soils with low PBI and CEC.
- Most nutrients will move away from drip tape and be located towards the outer edge of irrigated area.
- Take soil cores from outer area of the irrigated zone.
- Soils with elevated PBI and higher CEC values.
- Mobile nutrients will move away from drip tape and be located towards the outer edge of irrigated area.
- Immobile or lower mobility nutrients in these soil types such as P and K will remain close to the drip tape.
- A split sampling approach will be required.
- For mobile nutrients such as nitrate nitrogen, sulphur, chloride, boron and EC, take soil cores from outer area of the irrigated zone.
- For immobile nutrients such as phosphorus and potassium, take soil cores from near the drip tape.
A combination of correct soil sampling depth and sampling position with appropriately timed plant tissue sampling will provide valuable information for development and monitoring of effective nutritional management strategies in tree crop and grapevines.
Further Information
For further information, please feel free to contact me – david.mcrae@incitecpivot.com.au or 0477 987 321.
For additional information on soil sampling equipment and the sampling process read the:
- Agronomic Insights article – Spot on soil sampling smartfertilisers.com.au/spot-on-soil-sampling/
- Gourley CJP and Weaver DM (2019) A guide for fit for purpose soil sampling.
References
Gourley CJP and Weaver DM (2019) A guide for fit for purpose soil sampling, Fertiliser Australia, Canberra, Australia