Weighing up phosphorus investment for pastures
Lee Menhenett – IPF Technical Agronomist
As plants grow, they remove phosphorus from the soil to sustain numerous essential functions, such as stimulation of early root growth, hastening of maturity, stimulating flowering, and aiding in seed formation. The concentration of P in plants is 100 to 1000 times higher than that of the soil solution, meaning that phosphate is taken up by plant cells against a very steep concentration gradient.
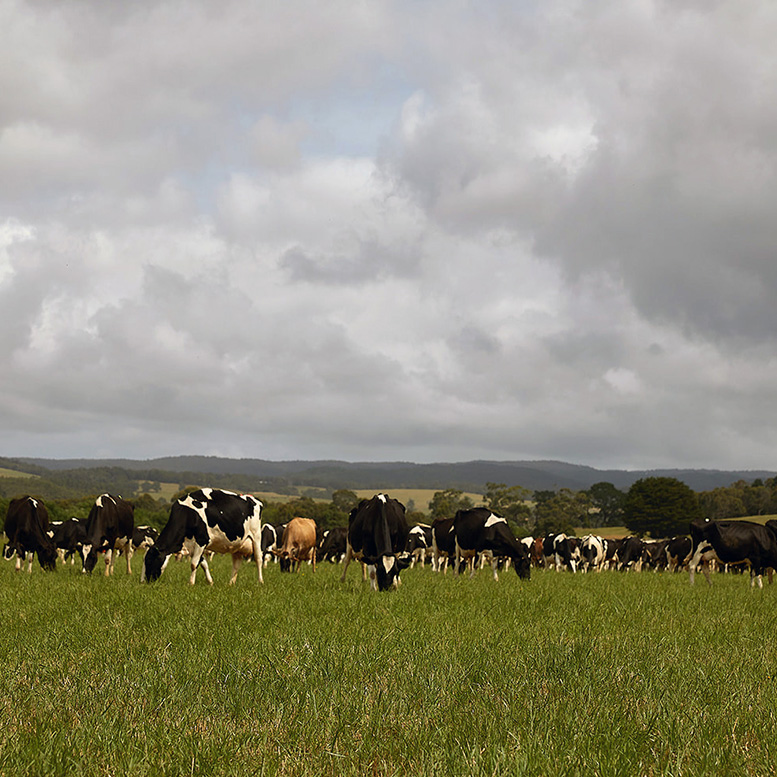
The ability to take up P differs between plant species. Legumes have weaker root morphology so have a higher soil P requirement than grasses. So, when soil P values fall below critical levels, legumes are the first species to drop out of the pasture sward. This means less nitrogen fixation in the pasture system, so grass performance decreases and weed invasion increases. Quality and quantity of the pasture sward decreases and so does livestock productivity.
Pasture systems are not closed – nutrients are exported (by livestock or fodder) and lost (through leaching or erosion). Cycling of nutrients to and from organic forms and mineral complexes, release and tie up nutrients like P, however, if P is not replaced at adequate rates to offset losses and soil tie-up, soil P levels will fall causing a productivity decrease.
Testing is key
Regular and sustained soil testing programs are the best tool for land managers to monitor and execute targeted nutritional programs. Trends in nutrient status, particularly P, are of greater value than isolated single paddock samples.
Decision making
Soil samples can help guide sensible decision making for fertiliser programs, but often there are other influences at play when growers are considering fertiliser investment and setting application rates. Commodity Prices
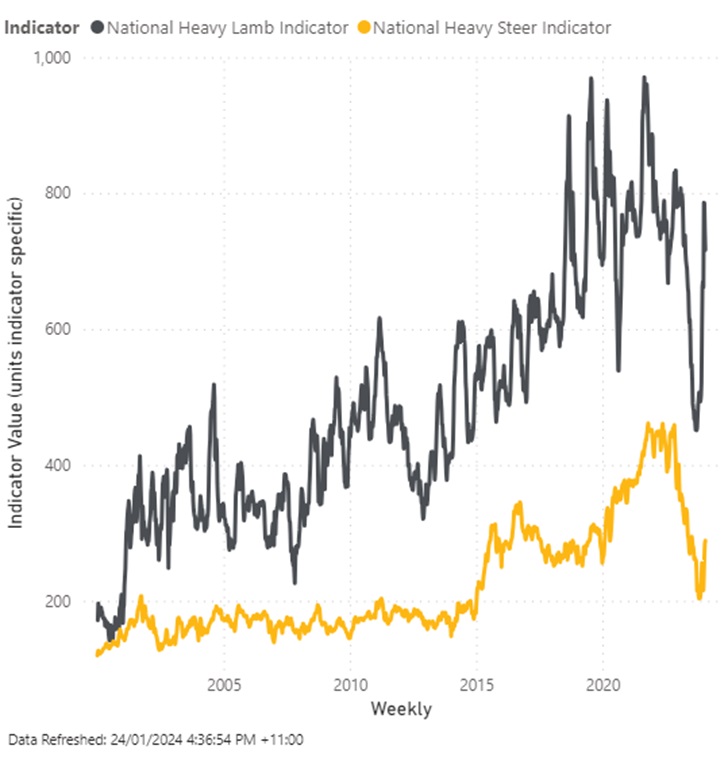
Cash flow and profitability are key drivers for farmers to invest in inputs. Graph 1 is the MLA weekly National Heavy Lamb and Heavy Steer Indicator from 2000 to 2024. The lamb indicator has had a sustained period of value increase since 2013 while the cattle indicator has also risen significantly since 2015. Both indicators decreased significantly in spring 2023, however, have rebounded to varying degrees and across different animal classes.
Stock numbers
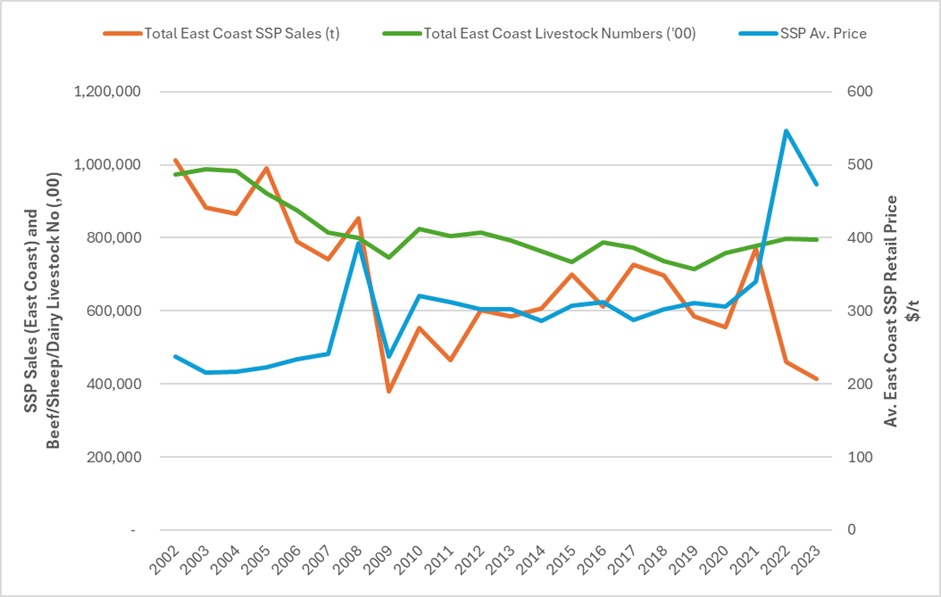
Higher stocking rates require a higher level of P to maintain fertility. Graph 2 shows stock numbers (sheep, beef and dairy cattle) since 2002. Numbers have been declining as farmers destocked during the millennium drought (2002-09) and again during the droughts in 2015 and 2018/19. The run of several good season since 2020 has seen stock numbers lift.
Fertiliser cost
Graph 2 also plots the average yearly SSP retail price. From the early 2000s SSP pricing was relatively stable ($200-$250) until there was a price shock in 2008 due to the Global Financial Crisis. Prices then found a new range in the low $300’s until more recent times when the Covid pandemic and international conflicts have driven prices to new highs and increased volatility.
Fertiliser sales & seasonal influence
A run of drier seasons earlier in the century dampened demand for SSP, aa did the price shocks of 2008 and 2022 . SSP volumes have decreased over time, due to commodity prices, stock numbers and fertiliser costs, there has also been some switching to higher analysis fertilisers as well.
Drier seasons, and in particular a run of drier years has a major influence on farmers requirements to purchase fertiliser. As mentioned, the millennium drought had a huge influence on most areas of eastern Australia, causing destocking, leading to financial tightening and lower requirements for fertiliser maintenance applications and ability/need for capital P rates.
P in 2024
We know the importance of phosphorus in legume-based pasture systems. The consideration for each farm is different based on season, commodity prices, fertiliser price, cash flow and profitability.
The downturn in livestock prices in spring 2023 was a shock, however, prices have recovered to varying degrees based on commodity and animal class.
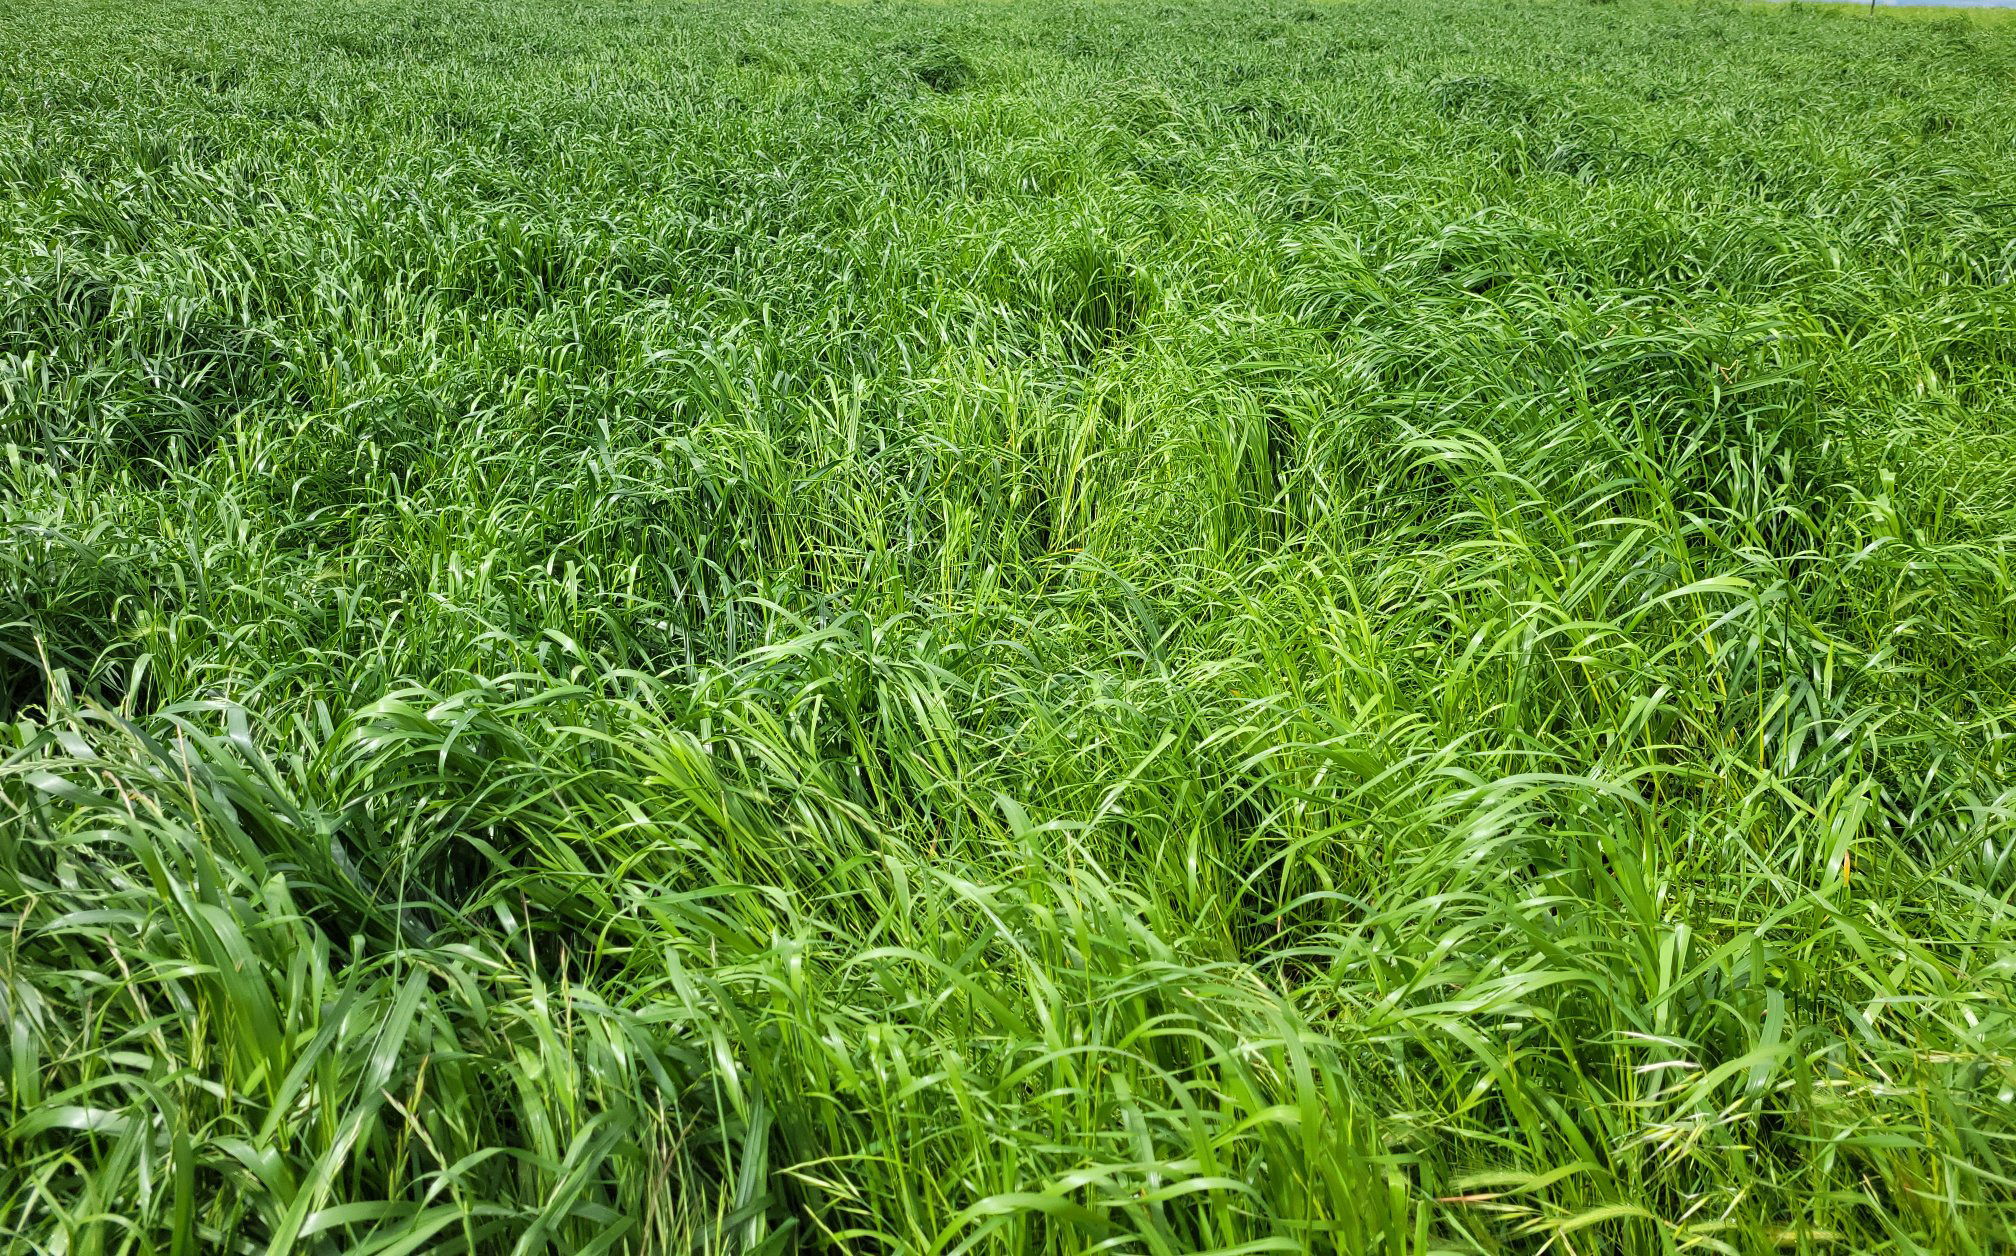
Pasture growth last year was exceptional and these high growth rates have continued into the summer of 2024. Summer rainfall has been plentiful and temperatures cooler, driving perennial pasture production. Very early sub clover germination and growth has been phenomenal. Only time will tell whether it survives through to winter, butthe high plant growth rates mean plant demand and uptake of soil P reserves has also been high. If soil P levels fall below critical levels, legumes will drop out and improved grass species production will also decrease.
What to do next
There is a great opportunity to maintain exceptional pasture performance with P applications. Don’t wait until the late autumn/winter to be disappointed in poor pasture production. Several good seasons in a row with some high rainfall events can leach sulphur from the root zone, so a balanced supply of P and S form SSP is a well-suited fertiliser. Organise soil testing across the farm to establish a robust fertiliser plan.
Further information
For more information on phosphorus strategies, feel free to contact me at lee.menhenett@incitecpivot.com.au or +61 412 565 176.
Horticulture, Pasture, Sugar, Summer Crop
Fertiliser use and GHG emissions being minimised on-farm
Pasture, Summer Crop
Foliar nitrogen solutions for a drier season
Winter Crop
The most critical piece of the winter crop puzzle