Squeezing the most from lime: Soil ‘buffer pH’ and correcting acid soils
Rob Dwyer – IPF Technical Agronomist
When it comes to soil, so much of what is good, and conversely so much of what can be bad, often relates to effective pH management.
Correct management of soil pH is crucial and requires accurate determination of appropriate ameliorant rates for both lime and dolomite.
The ‘buffer pH’ method can help growers squeeze the most from their lime application rates. This lab test determines accurate and specific lime rates tailored to individual soil samples and crop requirements.
Chemically, lime is calcium carbonate, CaCO3. Dolomite is calcium magnesium carbonate, CaMg(CO3)2. Both are referred to as ‘liming products’ because of their ability to reduce soil acidity. These ameliorants change soil acidity due to their influence on hydrogen ions (H+). Soil acidity is directly caused by an excess of hydrogen ions. Liming products raise soil pH (i.e. more alkaline) by first dissolving to produce carbonate. Each carbonate ion reacts with two hydrogen ions, to liberate water and carbon dioxide (see equation 1 below). By reacting hydrogen into water, it removes the acid-creating hydrogen ions from soil and so, soil pH rises (i.e. less acidic).
Equation 1: The chemical process via which liming products reduce soil acidity.
Carbonate + Hydrogen → Water + Carbon Dioxide
CO32- + 2H+ → H20 + CO2
Why ‘buffer pH’?
Buffer pH was originally derived from data relating to 85 Queensland soils. It is all about managing soil pH appropriately and within a crop’s specific optimal pH range. When soil pH is not managed well, many soil biological, chemical and physical properties can be adversely affected. Low, or acid, soil pH can be linked with these soil test results:
- low calcium
- low magnesium
- low calcium to magnesium ratio
- manganese toxicity
- high aluminium saturation
- soil dispersion
- high sodium percentage of cations (primarily in acid-sodic soils)
All of these detrimental soil properties can be amended, or corrected, when appropriate lime rates are applied.
Depending on location and proximity to lime deposits, lime can be an expensive input. Applying lime in excess of soil requirements is an unnecessary expense. Under application and soil constraints still favour limitations to crop productivity. These limitations can be costly in terms of compromised yield.
Additionally, pH is on a logarithmic scale meaning the longer it is not properly addressed, the higher the lime rates and greater the expense required.
What do the numbers mean?
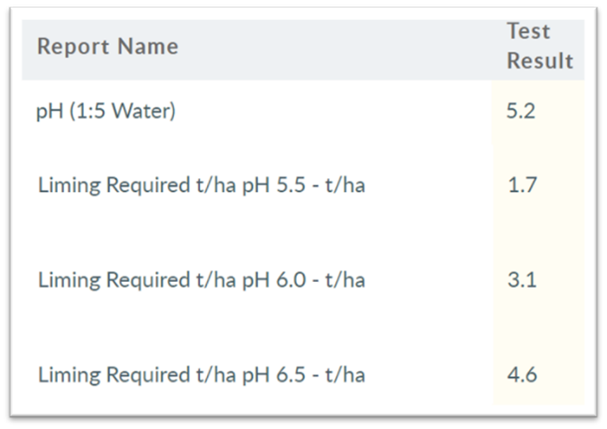
Buffer pH lab results
Buffer pH is a stand-alone method that quantifies a soil’s ability to resist, or buffer, increases in soil pH. Buffer pH cross-references to the soil pH determination of pH(1:5 water) method 4A1 – also referred to as pH(w). The Buffer pH values are only reported for pH(w) values lower than the 3 possible Buffer pH’s reportable of 5.5, 6.0 and 6.5 pHw.
The reported lab results for Buffer pH values are equal to lime rates, in tonnes per hectare (t/ha) for the pH(w)’s of:
5.5,
6.0, and
6.5.
Crop pH(w) optimal pH lab result
What determines which, or combination of the three possible Buffer pH results are listed in lab results?
It starts with the lab result pH(w) of each respective soil sample. Only Buffer pH’s higher than the pH(w)’s of 5.5, 6.0 and 6.5 will be reported. See Table 1.
The correct Buffer pH to use is then determined by cross-referencing with the optimal pH(w) range of the crop to be grown. The corresponding Buffer pH result is that of the lower end of each respective crop’s pH(w) optimal range. This is considered the appropriate pH(w) value to use, as a starting point. For example:
a) sugarcane, rhodes grass, kikuyu or clover-based pastures – the optimal pH range is 5.5 to 8.0 pH(w). The appropriate Buffer pH result to use is ‘Buffer pH Liming required t/ha 5.5’;
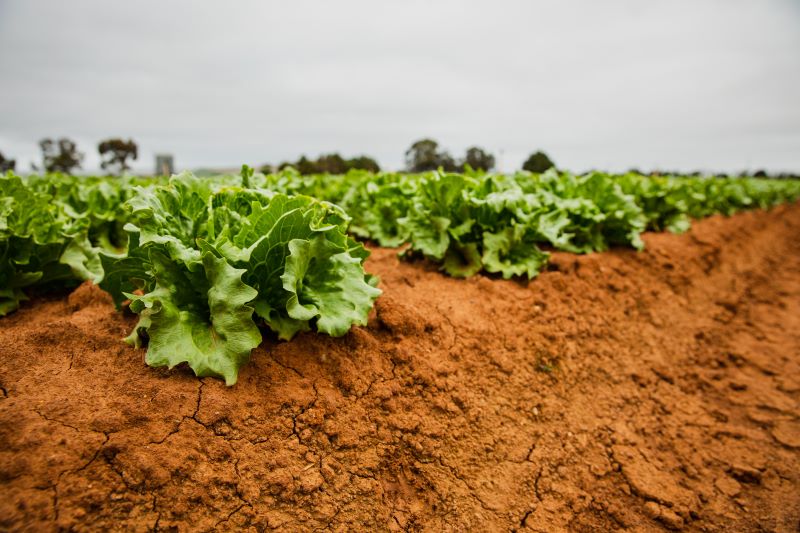
b) lettuce, oranges or custard apple – the optimal pH range is 6.0 to 6.5 pH(w). The appropriate Buffer pH result to use is ‘Buffer pH Liming required t/ha 6.0’; and
c) olives – the optimal pH range is 6.5 to 7.5 pH(w). The appropriate Buffer pH result to use is ‘Buffer pH Liming required t/ha 6.5’.
Note: It is for the adviser to then further determine if the ‘lower end’ of the optimal pH range is the most appropriate ‘pH target’ for each specific soil condition and crop.
Surface soil sampling depth correction
Very importantly, the Buffer pH lime rate should also be corrected for the crop’s appropriate surface (or shallow) sampling depth.
All Buffer pH lab lime rates are calculated ‘per 10 cm’ of soil sampling depth. Consequently, the Buffer pH lime rates must be corrected for sampling depth considerations, in 10cm increments.
For example, using Table 1 above:
- for sugarcane, which is soil sampled from 0-20cm (i.e. 2 of the 10cm depth increments) double the Buffer pH 5.5 rates (i.e. 2 x 1.7 t/ha = 3.4 t lime/ha)
- for both lettuce & olives, which are soil sampled from 0-15cm (i.e. 1.5 of the 10cm depth increments), so for lettuce increase the ‘Buffer pH 6.0’ by a factor of 1.5 (i.e. 1.5 x 3.1t/ha = 4.65 t lime/ha); and for olives increase the ‘Buffer pH 6.5’ by a factor of 1.5 (i.e. 1.5 x 4.6t/ha = 6.9 t lime/ha)
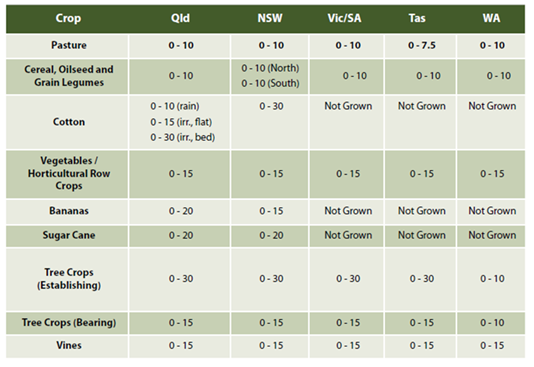
All appropriate surface soil sampling depths can be found on page 21 in the Fertcare publication – “A guide for ‘fit for purpose’ soil sampling”. For an excerpt, see Table 2.
Lime neutralising value correction
Lime and dolomite products, which are used to raise soil pH, use a quality measure referred to as ‘neutralising value’ (NV). Neutralising value indicates how effective the product is at correcting low soil pH. Ameliorants should be supplied with quoted and measured neutralising values. For greater accuracy, the Buffer pH lime rate should be corrected for the correct neutralising value using the equation below.
Equation 2: Neutralising value correction, where the NV is expressed as a whole number e.g. 85 or 90.
Neutralising Value’ corrected Buffer pH = Buffer pH from lab results x (100/Neutralising Value)
Soil bulk density correction
The Buffer pH liming rates assume a soil bulk density (BD) of 1 gram per cubic centimetre (g cm-3). For improved accuracy, if the sampling site soil has a bulk density other than 1, the Buffer pH lime rate can be corrected for the most appropriate bulk density.
Equation 3: Soil bulk density correction, where the BD is expressed as a digit to one decimal place on either side of 1 e.g. 1.1 or 1.3.
Soil bulk density’ corrected Buffer pH = Buffer pH from lab results x (soil bulk density/1)
The best accuracy is achieved with the Buffer pH test when the lab result is corrected for each the:
a) Surface soil sampling depth,
b) Ameliorant neutralising value, and
c) Soil bulk density.
Only then can you squeeze the most out of lime applications!
How to access the benefits of Buffer pH
The Buffer pH is test method available through Nutrient Advantage. It comes standard as an analyte on selected soil test codes like the:
• E43 comprehensive ‘sugarcane topsoil’ package;
• E94 and E95 ‘checkup soil’ package; and
• E75 ‘horticulture subsoil’ package.
Flexibility extends to where Buffer pH can be used as an ‘additional soil test option’ by adding this analyte to any existing soil test package code or even adding it to any custom soil test code.
The NALS ‘add-on’ code is ‘16C1.
Further Information
For additional information or advice, feel free to contact me on 0428 111 471 or rob.dwyer@incitecpivot.com.au
References
Gourley, C.J.P. and Weaver, D.M. (2019). ‘A guide for fit for purpose soil sampling’. Fertilizer Australia, Canberra, Australia.
Rayment, G.E. & Lyon, D.J. (2011). ‘Soil Chemical Methods – Australasia’. CSIRO Publishing, Collingwood, Australia.