Plant tissue analysis can get the most out of foliar K in chickpeas
IPF Technical Agronomist – David McRae
Crops require large amounts of potassium (K) to optimise plant growth and grain yields. Soil testing is an important tool for assessing K requirements and allowing K fertiliser rates to be calculated.
Generally, in heavy textured and high cation exchange capacity (CEC) soils, K is either applied pre-plant or at planting. However, once the crop is established, very little monitoring is conducted to assess the effectiveness of the fertiliser program.
Using plant tissue analysis at the appropriate crop stage can allow nutrient concentrations to be measured and fertiliser programs and application techniques modified if necessary.
Soil testing for K is an important tool for monitoring and identifying soil nutrient status. Traditionally, surface samples which vary from 0-10cm to 0-30cm depths have been used to interpret K fertiliser requirements. However, in environments that receive low in-crop rainfall and rely on stored soil moisture, assessing availability of K in the next sample segment e.g. 10-30cm below the surface layer can help identify responsive situations.
For K application strategies to be effective, they need to enrich a sufficient volume of soil in the root zone and this zone remain adequately wet to allow root access and plant K uptake during critical growth periods.
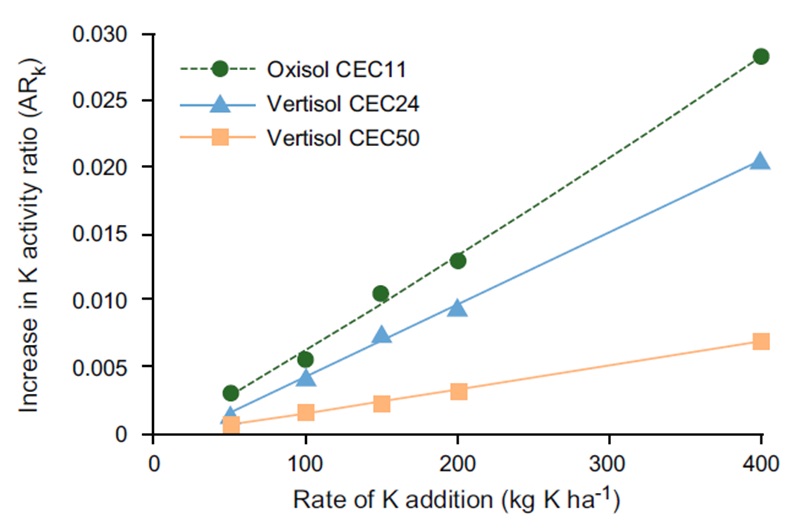
The effectiveness of applied K fertilisers is related to the size of the increase in soil solution K after K fertilisation and the location of applied K relative to active roots. The change in soil solution K (K activity Ratio (ARk)) in response to K fertilisation for different soil types with increasing CEC is presented in Figure 1.
Plant uptake of K is by diffusion, which is the movement of soil solution K to the root surface from a very small zone around the roots. Diffusion is dependent on concentration of K in the soil solution, soil type, soil moisture status and root volume.
When making changes to fertiliser programs or fertiliser application techniques, it is important to take measurements during the season and not just rely on final grain yield as an indication of performance.
Measure to manage
Plant tissue analysis is an underutilised tool for the measurement of nutrient concentration in plant tissue. The results of sampling plants when growing conditions are favourable show nutrient uptake, which combines the effects of physical, chemical and biological components of soil fertility. Plants respond to changes in nutrient availability more quickly than can be measured with soil testing.
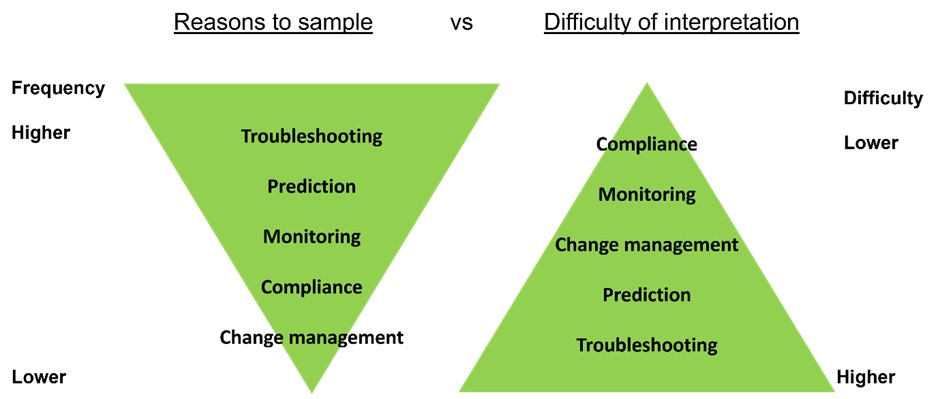
If the correct crop growth stage and plant part have been sampled, the adequacy of the current fertiliser program can be interpreted. The results provide information on actual nutrient availability and uptake from the root zone until the sampling date. An updated guide for Plant Sampling can be found at Plant Sampling (fertilizer.org.au) (Dowling and Blaesing 2022). Plant tissue sampling for nutrients is often employed to diagnose or trouble shoot issues with poor plant growth. As can be seen in Figure 2, using plant tissue analysis in this situation can be very difficult, often leaving the agronomist or consultant confused with the results. Proactively incorporating plant tissue analysis into fertility management to assess a management change or monitoring fertility levels are better applications of this tool.
There has been increasing interest in applying foliar K to chickpeas across North West NSW and southern Queensland as soil K levels are declining and K stratification is becoming more prominent. Growers and agronomists have been considering their application strategies and seeking further information to support their decisions. To measure plant tissue K at early flowering and to investigate the effects of foliar applied K at early flowering on chickpea grain yield, Incitec Pivot Fertilisers (IPF) conducted a replicated trial approximately 35 kilometres northeast of Moree in 2023. This was the second part of the trial outlined in “Keeping up with your K” (smartfertilisers.com.au/keeping-up-with-your-k/) article. The site had marginally low K in the surface sample (0-10cm) and was low in the 10-30cm sample (Table 1).
Table 1: Site soil analysis results for 0-10cm and 10-30cm samples
| Sample depth (cm) | 0-10 | 10-30 |
| Soil Texture | Clay | Silty clay |
| pH (1:5 water) | 7.61 | 8.19 |
| Chloride – mg/kg | 15 | 19 |
| Organic Carbon (W&B) – % | 0.55 | 0.41 |
| Phosphorus (Colwell) – mg/kg | 14 | <5 |
| Cation Exch. Cap. (CEC) – cmol(+)/kg | 25.9 | 28.3 |
| Potassium (Amm-acet.) – cmol(+)/kg | 0.26 | 0.171 |
| Available Potassium – mg/kg | 102 | 67 |
| Sodium % of Cations (ESP) – % | 5.0 | 6.9 |
The trial was planted on the 29th May using 70 kg/ha of CBA Captain into sorghum stubble harvested in 2023. The trial comprised of 10 starter fertiliser treatments (Table 2) with 4 replicates which was drilled into 12 x 2m plots on 32cm row spacings with narrow points. Starting soil moisture was 80cm.
Table 2: Starter fertiliser products and nutrient application rates
| Treatment | Rate | P (kg/ha) | K (kg/ha) |
| Untreated | – | 0 | 0 |
| GRANULOCK Z | 35 kg/ha | 7.6 | 0 |
| GRANULOCK Z | 70 kg/ha | 15.3 | 0 |
| ChicKP (S) Zn | 70 kg/ha | 7.7 | 12.6 |
| ChicKP (S) Zn | 140 kg/ha | 15.4 | 25.2 |
| N-K Blend | 45 kg/ha | 0 | 12.9 |
| N-K Blend | 90 kg/ha | 0 | 25.8 |
| EASY LIQUIDS 1 | 55 L/ha | 7.7 | 12.5 |
| EASY LIQUIDS 1 | 110 L/ha | 15.3 | 25 |
| EASY LIQUIDS 2 | 115 L/ha | 15.8 | 34 |
Potassium source was either potassium sulphate or potassium phosphate.
Each of the starter treatments had either no foliar fertiliser or 34 L/ha of EASY LIQUIDS K-FLOW 9 applied at early flowering (Table 3). Each foliar treatment was replicated 4 times.
Table 3: Foliar fertiliser treatments and nutrient application rates
| Treatment | Rate | N (kg/ha) | P (kg/ha) | K (kg/ha) |
| Untreated | – | 0 | 0 | 0 |
| EASY LIQUIDS K-FLOW 9 | 34 L/ha | 1.0 | 0 | 3.1 |
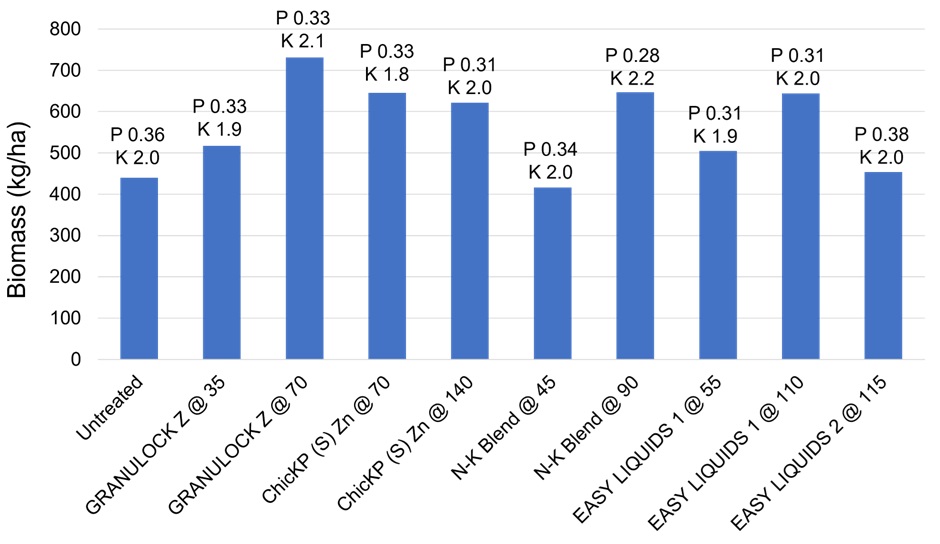
Three rows in one replicate covering 1 m2 were cut at ground level for biomass calculation and plant tissue analysis at early flowering. The results are present in Figure 3. Each starter treatment has plant tissue phosphorus (P) and potassium (K) concentrations label at the top of the respective column.
Biomass weights varied between starter treatments with higher P rates generally increasing plant biomass. All P concentrations with exception of the N-K blend applied at 90 kg/ha were within the optimum range of 0.29-0.55%.
The variation in K tissue concentration was less, ranging from 1.8 to 2.2%. The optimum range for K is 2.0-3.6%, with only two starter treatments having a higher concentration than 2%.
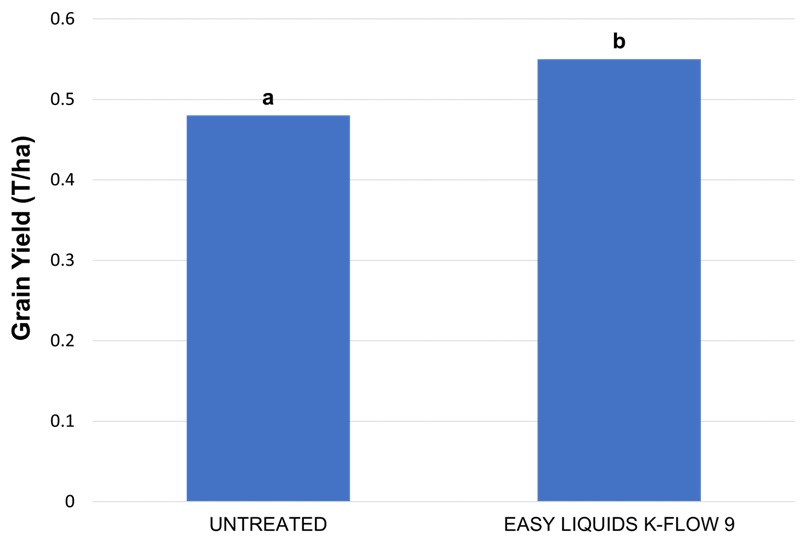
The site received no effective rainfall from planting to harvest. As a result, low grain yields were recorded at harvest (Figure 4). There was no response to any fertiliser treatment applied at planting (presented in previous article) but a significant yield response to foliar applied K-FLOW 9.
Results of plant tissue analysis showed that most starter treatments may be likely to respond to foliar applied K with a dry rainfall outlook. If the bottom of the optimum range is taken as the critical value – 2.0%, the treatments that had K values of 2.0% then 50% of the plants sampled in these treatments are deficient (by the definition of an average, 50% of values either side of the average value).
Overall, plant tissue analysis results show that there has not been luxury uptake of K as the applied K fertiliser has been stranded in dry soil for a significant period of crop growth. This meant that crop nutrient uptake was reliant on the availability of nutrients in the lower soil levels.
Kataria and Singh (2013) found that K fertilisation could reduce the effects of water stress on chickpea grain yields in K responsive situations. Yield increase in this trial appears to be from higher seed numbers as grain weights did not vary. Foliar K may have a role in increasing water stress resistance and stabilising grain yields.
Managing K this season
If you are growing chickpeas this season and considering applying foliar K, below are some points to consider:
- Take whole top plant samples 10-14 days before flowering and send them to the Nutrient Advantage laboratory Nutrient Advantage.
- Use PT4 plant tissue sample code.
- If plant tissue results indicate low or marginal K concentrations, check rainfall outlook as rewetting of surface soil layers that contain adequate K or fertiliser K will allow rapid plant uptake and reduce potential foliar responses.
- Foliar K application required.
Further Information
For further information, please feel free to contact me – david.mcrae@incitecpivot.com.au or 0477 987 321.
To discuss Foliar K application requirements contact Matt Urquhart – 0429 789 298, EASY LIQUIDS Moree.
You can also contact Bede O’Mara – 0417 896 377 bede.omara@incitecpivot.com.au
References
Bell MJ, Mallarino AP, Volenec J, Brouder S, Franzen DW (2021). Considerations for Selecting Potassium Placement Methods in Soil. In ‘Improving Potassium Recommendations for Agricultural Crops’. (Eds T. S. Murrell et al. (eds.), pp. 341-362. https://doi.org/10.1007/978-3-030-59197-7_12
Dowling CW and Blaesing DT (2022) Plant Sampling for Agriculture – A Guide, Fertilizer Australia, Canberra, Australia. Plant Sampling (fertilizer.org.au)
Dowling CW and Blaesing DT (2023) Plant Sampling for nutrient analysis. Soil Network of Knowledge webinar. Plant Sampling (fertilizer.org.au)
Kataria N and Singh N (2013) Amelioration of water stress by potassium fertilizer in chickpea (Cicer arietinum L.). Journal of Tropical Plant Physiology 5 (2013): 22-32.