Optimising pasture health with plant tissue testing
Fiona McDonald – IPF Technical Agronomist
Maintaining healthy pastures is essential for livestock productivity and sustainable farming practices. A plant tissue test is one of the most effective tools to ensure plants are taking up nutrients from the soil. By analysing the nutrient content in plant tissues, farmers can make informed decisions about soil and plant nutrition to improve quality and Dry matter (DM) production of their pastures.
This article explores the process of plant tissue testing in pastures, the significance of response curves, and how farmers can use this information to enhance pasture management.
Importance of plant tissue testing
Plant tissue testing serves as a diagnostic tool to monitor the nutrient status of pastures, it provides a more reliable guide to micronutrient levels than soil testing. They can be used to compliment soil analysis and support fertiliser program decisions. This method allows for a more accurate assessment of the pasture’s nutritional needs, helping to identify any deficiencies or imbalances that might hinder growth and productivity.
Benefits of plant tissue testing
- Early detection of nutrient deficiencies (hidden hunger). Plant tissue testing can detect nutrient imbalances before they become visible through symptoms and pasture quality and DM is compromised.
- Improved yield and quality. Ensuring that your pasture plants receive the right nutrients at the right time leads to healthier, more productive pastures. By understanding the specific nutrient needs of your pasture, you can apply fertilisers more efficiently, improving return on investment, whilst reducing waste and your environmental impact.
Taking a plant tissue test
Table 1. Pasture tissue testing, crop, timing and plant part (Source: Fertcare Plant Sampling Guide)
| Crop | Timing | Plant Part | No Needed |
| Annual medics and clover | Active growth prior to flowering. | Youngest open leaves and petioles. All above ground parts. | 50 |
| Lucerne | Prior to flowering. | Growing tips (upper 10–15 cm of stems). All above ground parts. | 30 |
| Temperate grasses | During active growth. | Youngest mature leaf blades. Whole tops cut 3–5 cm above soil level. | 40 |
- Representative sample: the sample must represent the situation examined. Avoid atypical areas e.g. dung and urine patches, troughs, stock camps, gateways, fence lines, etc.
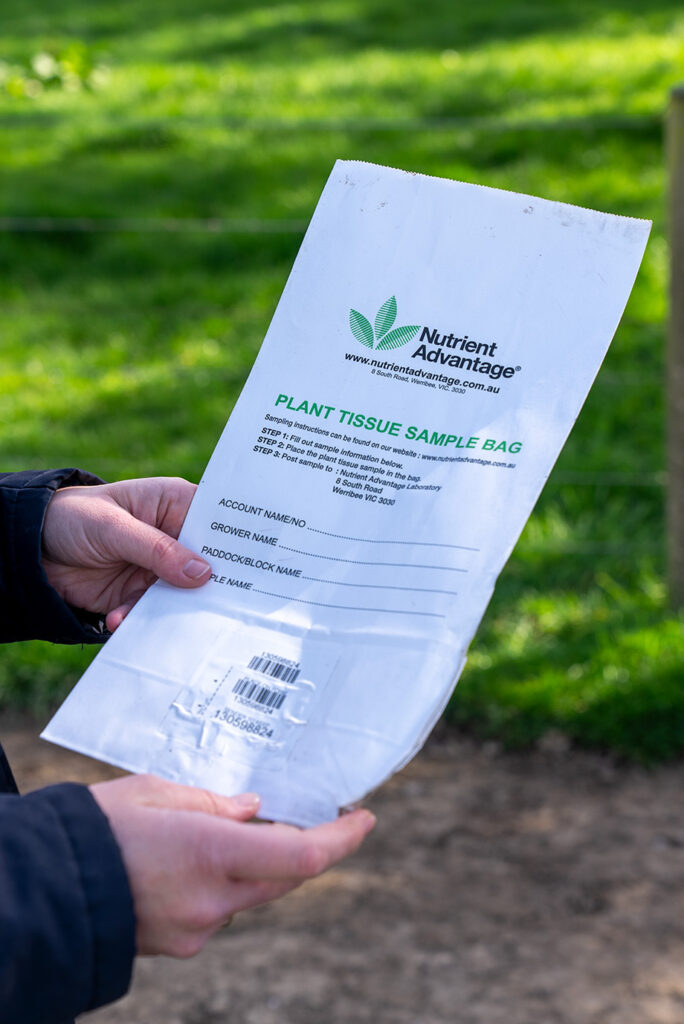
- Sample handling: Place samples in a clean non bleached paper bag to prevent decomposition. Do not use plastic bags, as it can cause sweating and compromise sample quality. If there is a risk of contamination, you can request the samples be washed prior to testing at the lab.
- Submission and post: Accurately record sample details and send the samples to the laboratory early in the week to avoid delays. Otherwise, samples can be refrigerated for a short period of time, do not freeze.
Understanding response curves
Response curves illustrate the relationship between nutrient concentration and plant performance. These curves are important in interpreting the results of plant tissue testing.
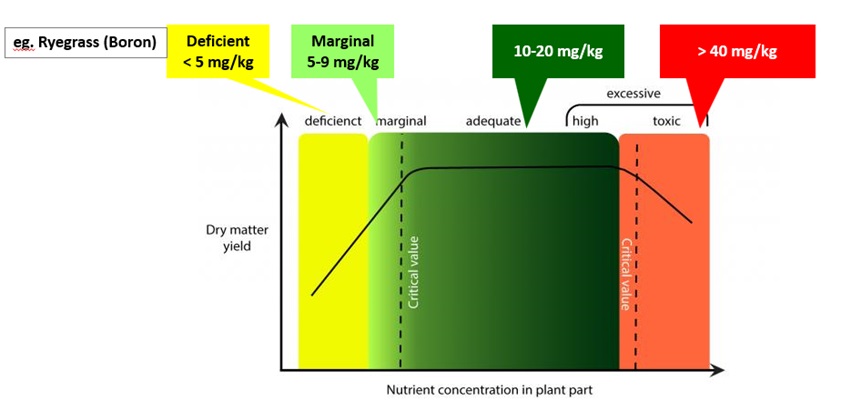
There are three parts to a response curve (shown in the graph below):
- Deficiency range: Nutrient concentration is below optimal, leading to reduced DM yield.
- Sufficiency range: The optimal range where plants achieve maximum DM yield.
- Toxicity range: Excess nutrients begin to negatively impact plant health and productivity.
An example shown below is the response curve of Boron in Ryegrass, outlining the nutrient ranges for if ryegrass would be classed as being deficient, marginal, optimal, or toxic.
Applying insights from plant tissue testing
After receiving the results from plant tissue testing, farmers can take steps to optimise pasture production. If a deficiency or toxicity is detected, and a recent soil test has been undertaken, nutrient imbalances or interactions can be identified. This can be corrected with appropriate soil amendment or fertiliser, ensuring to follow the 4R’s; Right Rate, Right Timing, Right Placement, and Right Product.
If nutrient concentrations are within the optimal ranges, the fertiliser program may be fine-tuned. Continue to monitor with regular soil and plant tissue testing.
Plants with high concentrations of some elements consumed by animals may have adverse health implications, such as grass tetany. Many factors contribute to this, and various management strategies can reduce the risk.
Plant tissue testing is a powerful tool for pasture management, providing insights that go beyond traditional soil testing. By understanding and applying the principles of response curves, farmers can optimise their fertiliser strategies, leading to improved pasture and livestock productivity, and enhanced sustainability.
Further information
For more guidance or information on plant tissue testing, visit the Nutrient Advantage website or contact:
Fiona McDonald 0488 772 144 or fiona.mcdonald@incitecpivot.com.au
References
Dowling CW and Blaesing DT (2022) Plant Sampling for Agriculture – A Guide, Fertilizer Australia, Canberra, Australia.
Plant Analysis: An Interpretation Manual, CSIRO Publishing, DOI: 10.1071/9780643101265 https://ebooks.publish.csiro.au/content/9780643101265/9780643101265