Make grain testing a priority this harvest
Grain testing is available from Nutrient Advantage® and while it doesn’t replace soil testing, is a quick way to see how much nutrient has been removed from the paddock.
Jim Laycock, IPF Senior Technical Agronomist
Nutrient Advantage grain testing
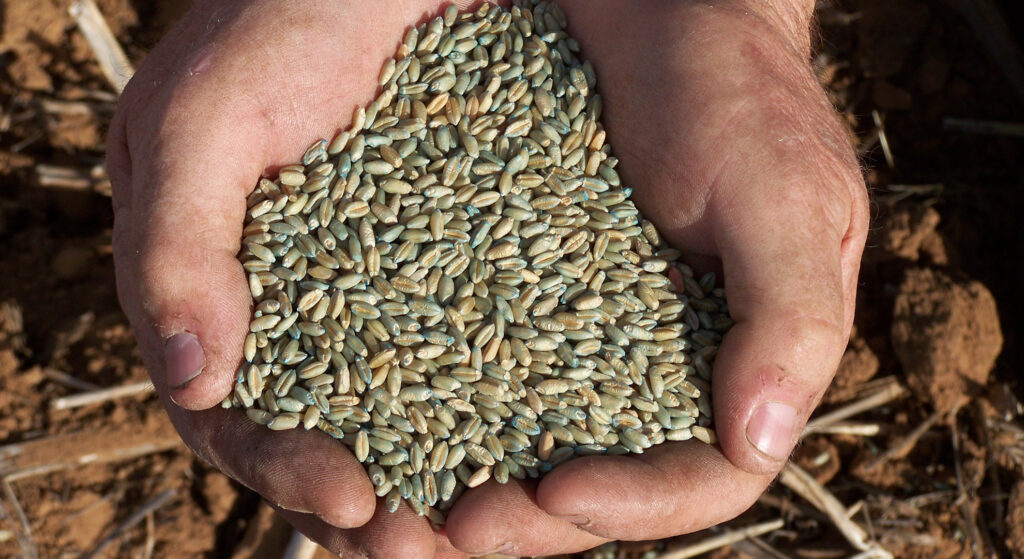
If you haven’t tried it yet, it’s as simple as collecting 400 grams of seed off the header, putting it in a plant tissue test bag and submitting it to the Nutrient Advantage® laboratory under the code G1. The test is available for wheat, barley and other cereals, plus canola and pulse crops.
When you get the results back, they are presented in mg/kg or percentage terms, plus scaled up to ‘nutrient removed per tonne of grain’ for convenience. Multiply the nutrient removed per tonne of grain figure by the yield from the crop and you quickly see how much of the nutrient has been removed from the paddock.
In the past, standardised removal tables have been used to estimate nutrient removal, but we know there is a large natural variation between paddocks.
Putting a figure on the exact concentration of phosphorus in the grain harvested significantly improves recommendations. Regular soil testing is still needed to see if soil nutrient levels are changing in response to application rates and to see where individual paddocks are sitting in relation to critical values. However, for situations where paddocks are at optimal Colwell P levels and growers only want to replace the phosphorus removed at harvest, grain testing can be particularly valuable.
For wheat, the test also reports the levels of zinc and phosphorus per seed, as a guide to potential seedling vigour. Strong seed vigour has been found with greater than 500 nanograms of zinc per seed1 and 130 micrograms of phosphorus per seed2. Where wheat grain is below these benchmarks, growers may need to consider another seed source or additional fertiliser to support early growth. I think most growers would agree that it is better to know this sooner rather than later.
Step by step grain testing:
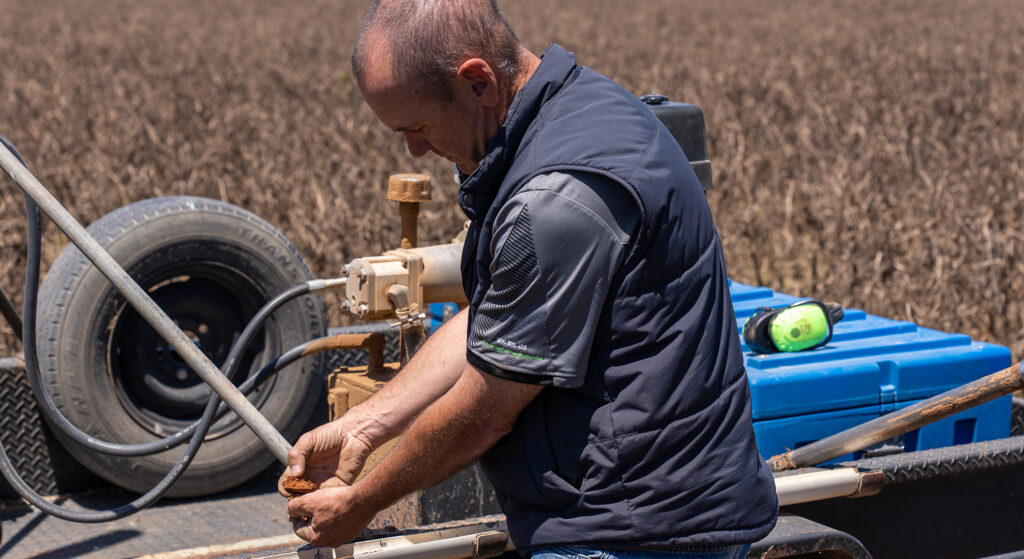
1. Collect samples by paddock, crop or area as required.
2. Supply approximately 400 grams of threshed seed (no stalks), in a Nutrient Advantage plant tissue test bag.
3. Submit to the laboratory under the code G1. 4. Receive your report.
Your report will include:
• Moisture percentage
• Nutrient results (in mg/kg or % units)
• Some important nutrient ratios
• 1000 grain weight (for wheat only)
• Seed zinc and phosphorus contents (for wheat only),
• Nutrient removal scaled up to 1 t/ha yield
Moisture percentage and 1000 grain weight are reported to allow an appropriate seeding rate to be accurately calculated.
Make grain testing a priority this harvest. It’s a simple and inexpensive way to get a head start on nutrient budgeting.
Further information
For more information, feel free to contact me at jim.laycock@incitecpivot.com.au or 0427 006 047. If plant sampling bags are required contact Nutrient Advantage on 1800 803 453.
References
1. Rengel Z & Graham RD (1995) ‘Importance of seed Zn content for wheat growth on Zn-deficient soil’ Plant and Soil, 173: 259-266, 1995.
2. DG De Marco (1990) ‘Effect of seed weight, and seed phosphorus and nitrogen concentrations on the early growth of wheat seedlings’ Australian Journal of Experimental Agriculture, 30, 545-9, 1990.