Low levels of Sulphur in southern regions
Clint Sheather – IPF Technical Agronomist
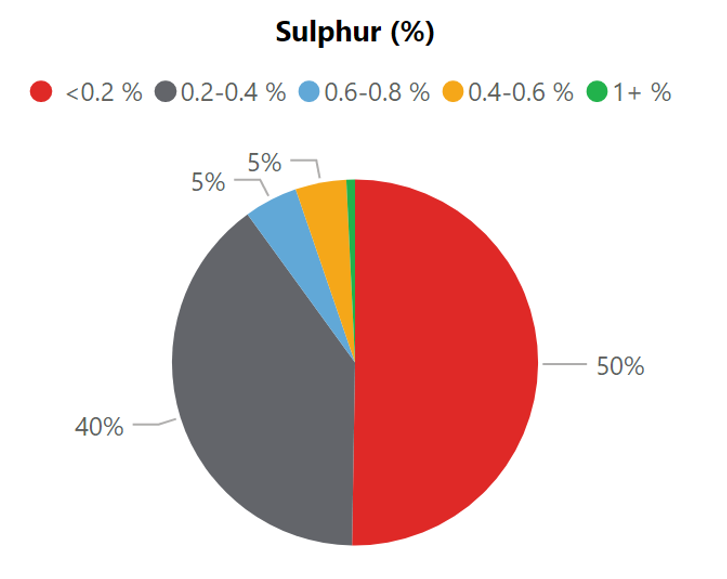
Analysis of results from 76,000 soil and plant tissues tests conducted over the past three years reveals 30% soil samples from NSW, Victoria and South Australia are low in sulphur (<6 mg/kg). Over the same period 95% of tissue tests were below the normal sulphur range for canola.

Figure 1. Nutrient Advantage sulphur soil testing results 2021-2023

In-crop tissue testing – understanding what the plant is telling us
Tissue testing is an under used tool in broadacre cropping – often seen just as a diagnostic tool. However, tissue testing can complement soil testing and tell you what nutrients have been taken up by the crop.
Regular tissue testing along with historical crop yields and soil tests provides additional information for targeted crop nutritional management. This is important as farming systems and management practices change – effecting nutrient availability and distribution.
Why use tissue testing?
Plant tissue analysis is normally used for one of two main reasons:
a) Diagnostic – to determine the reason for poor growth (troubleshooting)
b) Monitoring – to assess the suitability of current fertiliser management practices.
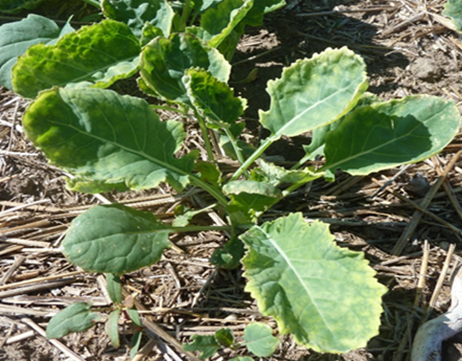
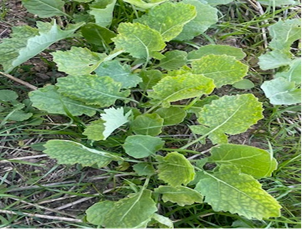
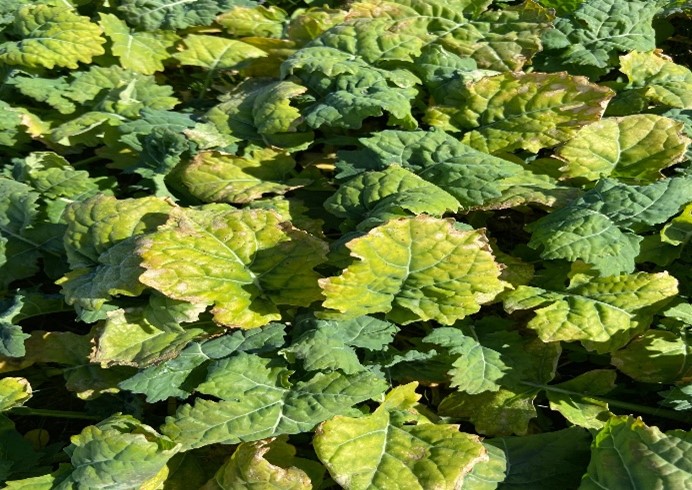
It is an important tool as soil tests are not reliable for some micronutrients such as copper or boron; and visual plant symptoms can easily be confused or misinterpreted. For example, S deficiency can often be incorrectly diagnosed as manganese toxicity and vice-versa as seen in Figures 4 and 5. Tissue testing is a valuable tool for differentiating between deficiency and toxicity symptoms which are similar. Figure 6 illustrates a scenario where nitrogen as urea was applied with little response due to the incorrect diagnosis of potassium deficiency.
Nutrient concentration
Plant tissue testing shows nutrient concentration in plant tissues, as it relates to plant performance. The relationship between critical plant tissue concentration and plant performance can be seen in Figure 7 below. If nutrient concentration is below the critical range, then plants are considered deficient. The range where nutrient concentration in the tissue increases, but performance does not, is considered the sufficient range. Beyond the sufficient range, excessive nutrient concentrations can limit plant performance, and this is considered to be the excessive or toxic range. Plant tissue concentration must be adequate throughout the entire soil profile to satisfy yield potential.

Considerations when taking crop tissue tests
Detailed sampling instructions can be found on the Nutrient Advantage website – Sampling Instructions (nutrientadvantage.com.au) – Sampling Procedure – Plant Tissue.pdf (nutrientadvantage.com.au)
Careful planning
For accurate tissue testing results, it is important to take representative and comparative samples.
Tissue collection should be taken from areas that are free from any obvious constraints and contaminants including previous fertiliser and soil amendment sites.
Correct plant part
The accuracy of the tissue test results is determined by the accuracy of the sample. For tissue tests to provide meaningful results the correct plant part must be sampled. Samples from the incorrect plant part can be difficult to interpret as established critical values may not exist.
Right time
Sampling should always be conducted early in the week to ensure the samples arrive promptly to the laboratory. Weather and environmental factors can also influence nutrient concentrations. Samples should be taken when plants are actively growing in the presence of sunlight.
Interpretation and Analysis – Nutrient Advantage Laboratory
Samples should be submitted to the Nutrient Advantage Laboratory using the plant tissue test codes PT4 or PT6.
Samples can be submitted using the LabSTREAM® app designed for quick and easy paperless submission into NA Pro. NA Pro is an online decision support system designed to assist in the interpretation and reporting of soil, plant tissue and water test information.
Nutrient Advantage® is a NATA accredited and ASPAC certified laboratory.
Correcting deficiencies
Once identified, blending urea with sulphur products like GranAm is an effective way to deliver both nitrogen and sulphur. Nutrient deficiencies such as sulphur in canola can be treated with specific fertiliser applications as custom blends or Range products such as STIMULUS or EXTRA SUL (see Table 1). If a specific analysis or fertiliser formulation is required IPF can cater to these requirements through a custom blend.
| IPF Range products | N-P-K-S analysis % |
| EXTRA SUL | 31.8-0-0-13.2 |
| STIMULUS | 29.9-0-0-15 |
| UREA DOUBLE S 60/40 | 35.7-0-0-9.6 |
| UREA S 80/20 | 40.8-0-0-4.8 |
| UREA S 50/50 | 33.2-0-0-12 |
| UREA S 70/30 | 38.3-0-0-7.2 |
| UREA S 75/25 | 39.6-0-0-6 |
Key points
- The past three years show 30% soil samples from NSW, Victoria and South Australia are low in sulphur.
- 95% of tissue tests were below the normal sulphur range for canola nationally.
- Tissue testing can be used to tailor a nutrient management plan.
- Correct sampling and analysis are required to achieve meaningful results, ensuring the correct part of the plant is sampled.
- The Nutrient Advantage software, NA Pro, is a useful tool to assist in nutrient interpretation and decision-making.
- Consider adding Gran-Am with your nitrogen application.
Further Information
For additional information or advice feel free to contact me on 0475 439 316 or clint.sheather@incitecpivot.com.au
You can also contact:
- Jim Laycock 0427 006 047 jim.laycock@incitecpivot.com.au or
- David McRae 0477 987 321 david.mcrae@incitecpivot.com.au
References
Dowling CW and Blaesing DT (2022). Plant Sampling for Agriculture – A Guide, Fertiliser Australia, Canberra, Australia.
McGrath JM, Spargo J, & Penn CJ (2014). Soil fertility and plant nutrition. In Plant Health (pp. 166-184). Elsevier.
Reuter D & Robinson JB (eds.) (1997). Plant analysis: an interpretation manual. CSIRO publishing.