Down, down, soil phosphorus levels are down…
Lee Menhenett – IPF Technical Agronomist
It’s interesting to look back at key crop production factors to gain a view of the present and a glimpse into what may be required into the future.
Sounds deep … maybe not. By linking annual rainfall charts and associated grain production to soil phosphorus levels, some interesting patterns emerge.
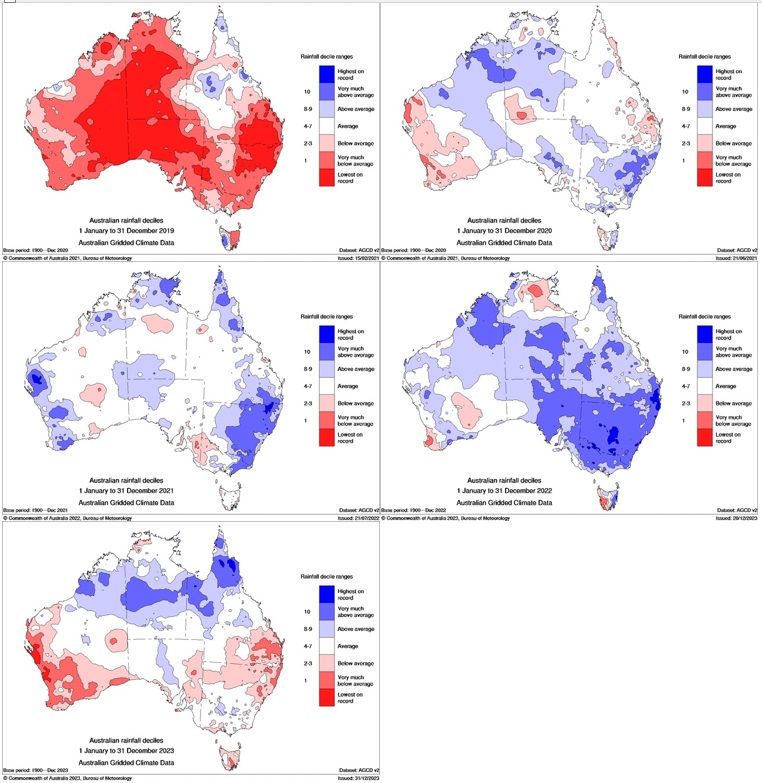
Figure 1 shows the rainfall decile charts for Australia from 2019 to 2023. 2019 had significant rainfall deficiencies across the country, however since 2019 there has been a terrific run of seasons (average or above average) in the southern cropping zone (in 2021 and 2023 parts of the Mallee and mid north SA had below average rainfall).
Grain production is directly linked to moisture, so it stands to reason that with the run of good seasons, grain yields have also been excellent. Graph 2 uses data from Australia Crop Forecasters to highlight state and national grain production. In 2023 northern NSW and WA had poor seasons significantly decreasing grain production. Severe flooding in 2022 took away top end yields in certain districts.
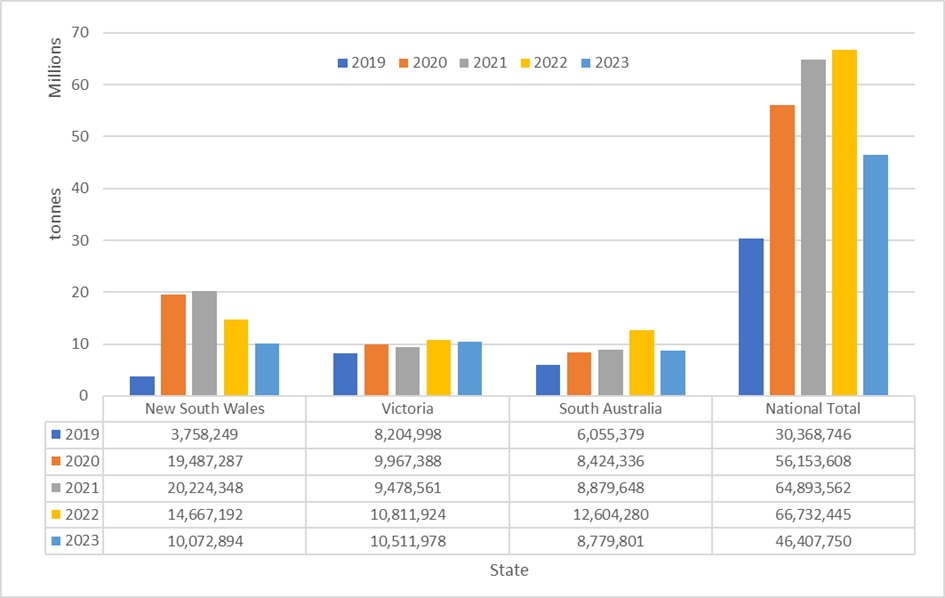
Source: Australian Crop Forecasters
Higher grain yields remove more nutrients from the cropping system. So, it would be expected that Soil P reserves will fall after a series of higher yielding seasons and no increases to phosphorus (P) maintenance rates to meet that increased removal.
Norton (2009) reported that mean P concentrations for wheat ranged from 2.3-3.6 kg P per tonne of wheat and canola (Norton 2014) ranged from 3.6-7.2 kg P per tonne. Higher yielding crops will tend to have a lower nutrient concentration, however overall removal can be higher due to the larger yield.
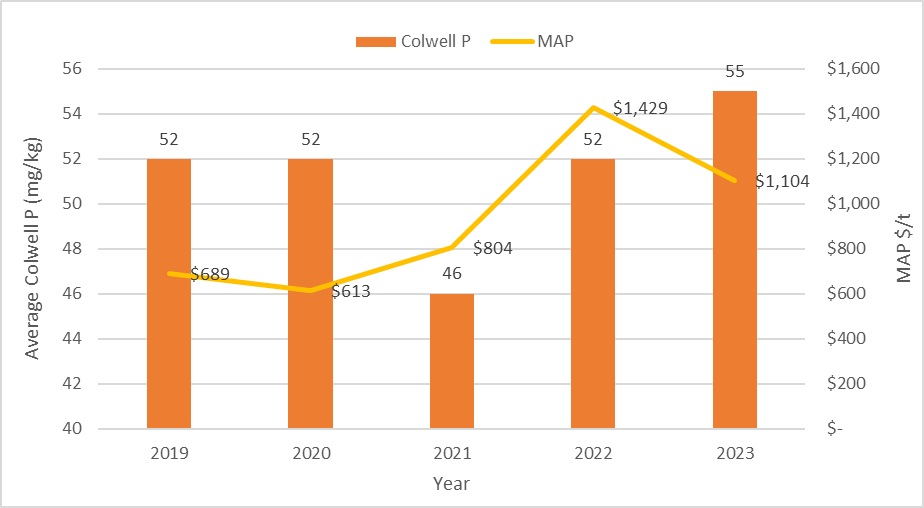
Nutrient Advantage laboratory data of southern winter crop Colwell P values, shows that in 2019 (following several below average rainfall years) average soil Colwell P values were 52 mg/ha (Graph 3). After a reduction to 46 mg/kg in 2021, the average value in 2023 was 55 mg/kg.
For paddocks with Colwell P levels above the optimum level, running soil P levels down is a sound strategy. However, if soil P levels are less than the optimum then yield will be compromised.
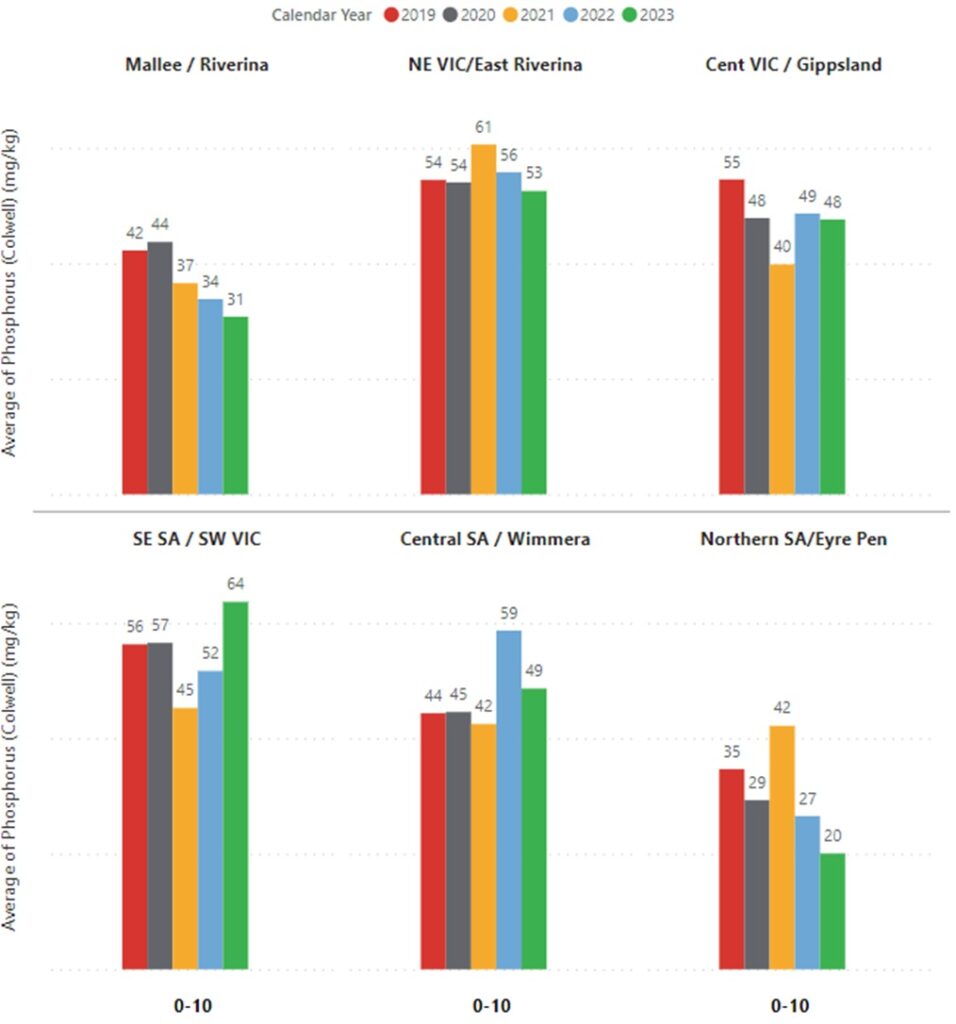
Graph 4 shows the average Colwell P trends by year by southern cropping districts. The districts of Mallee / Riverina and Northern SA / Eyre Peninsula show a steady trend of declining average Colwell values. NE Vic / East Riverina and Central SA / Wimmera show a decline in average Colwell P values since last year.
Managing fertiliser costs has also been a major grower consideration over the last several years. Historically high ammonium phosphate prices have also driven some farmers to reduce sowing rates. Again, in the right circumstances this is a sound strategy, but applied incorrectly this strategy potentially costs more than the dollars saved on a tonne of fertiliser. Graph 3 highlights estimated retail MAP pricing over the last 5 years. Regular soil testing is key to monitor soil P levels over time at individual paddock level, and grid sampling is preferable as it helps growers better understand and manage spatial variation.
A period of excellent seasons has produced a run of higher yielding crops, drawing a greater amount of nutrients from our cropping systems. This combined with higher priced fertilisers may have also led to lower sowing application rates.
Monitoring soil P levels through soil testing is critical whether the individual farmer nutrient application strategy is:
- maintenance based on removal,
- capital to lift soil P levels into optimum range, or
- mining by reducing P application rates below removal rates to decrease >optimum soil P levels.
Further information
For more information on phosphorus strategies, feel free to contact me at lee.menhenett@incitecpivot.com.au or +61 412 565 176.
You can also read the IPF Fact Sheet “Making sensible phosphorus decisions” https://smartfertilisers.com.au/making-sensible-phosphorus-decisions/
References
Australian Crop Forecasters. Winter Crop Estimates.
Bureau of Meteorology. Australian Rainfall Decile Ranges.
Norton R (2009) Grain Nutrient Concentrations – report on a survey from 70 NVT wheat sites. International Plant Nutrition Institute, Australia and New Zealand.
Norton R (2014) Canola seed nutrient concentrations for southern Australia. ARAB XVIII Conference Proceedings.